


What is Graph Navigation?
Graph Navigation is a platform service introduced in Aras Innovator 11.0 SP15 that allows users to quickly visualize and navigate data structures via a node-edge graph. Since Graph Navigation is a service of the Aras Innovator platform and not a feature of a specific application, users can explore data across all applications. Graph views also obey the permissions and access controls defined for your item data.
Quick Start
Graph Navigation provides a framework for customizing the content and style of your graph views, but Aras Innovator also includes a default style out of the box to get you up and running quickly. Getting started with Graph Navigation in Aras Innovator is as easy as adding an action to an ItemType. We'll use Part for our example here.
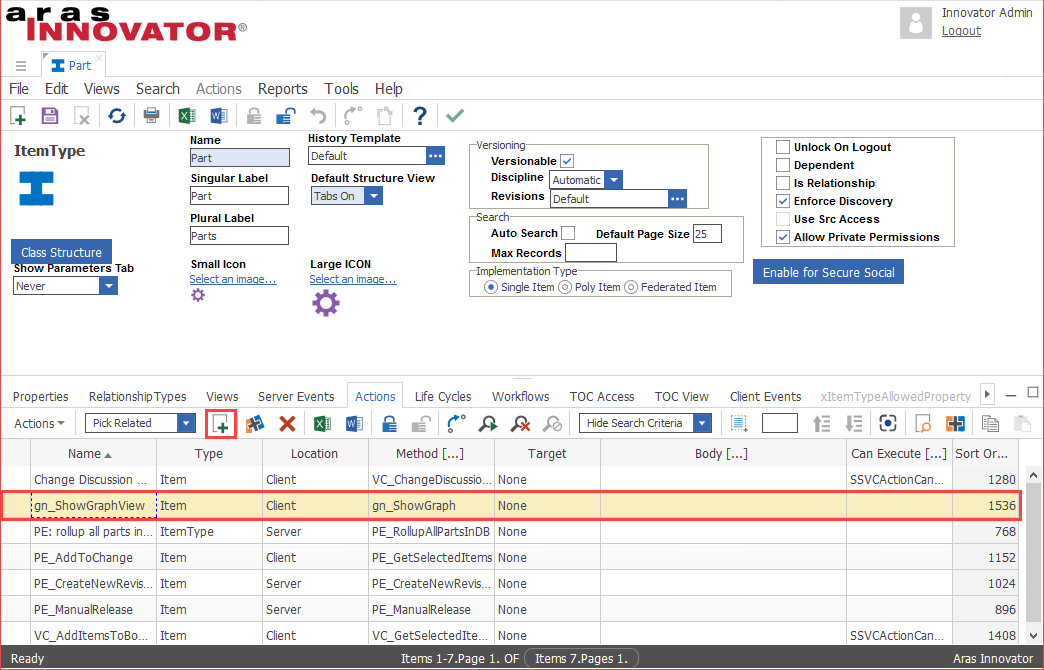
- Navigate to Administration > ItemTypes in the TOC.
- Search for the Part ItemType and open it for editing.
- Select the Actions tab and click the Add New button to pick a related Action.
- Search for the gn_ShowGraphView Action and double click to add it to the Part ItemType's actions.
- Save and close the Part ItemType.
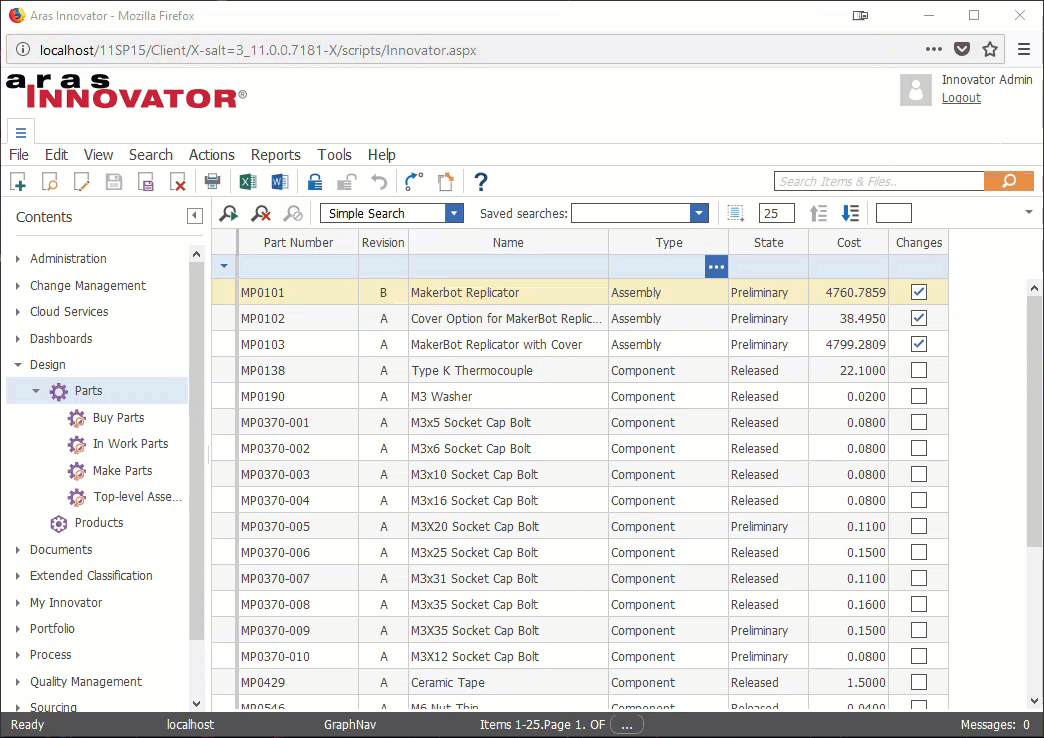
Now we'll be able to view Parts and their related data using Aras Innovator's default graph settings. In the next section we'll explore the features of the graph viewer.
Navigating the Graph Viewer
Opening Graph Views
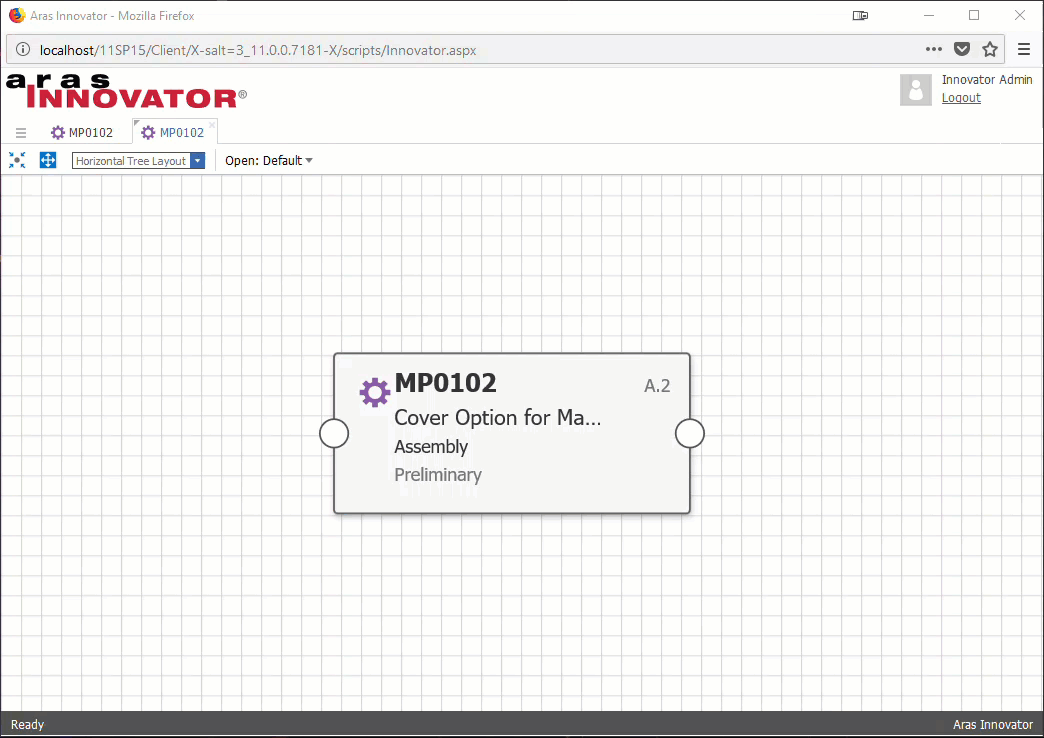
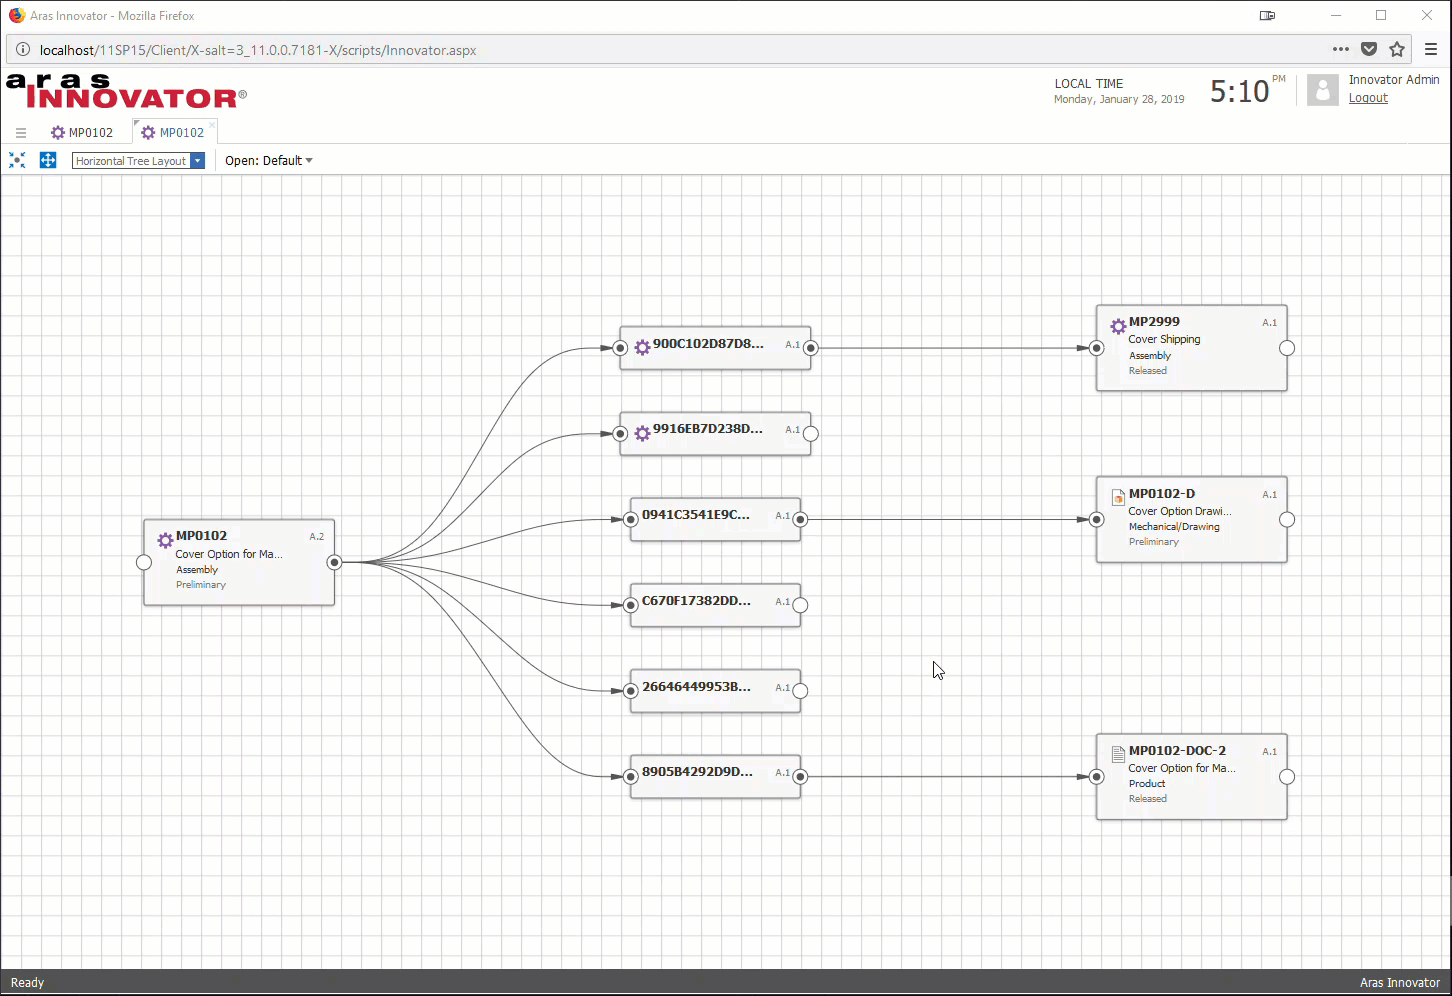
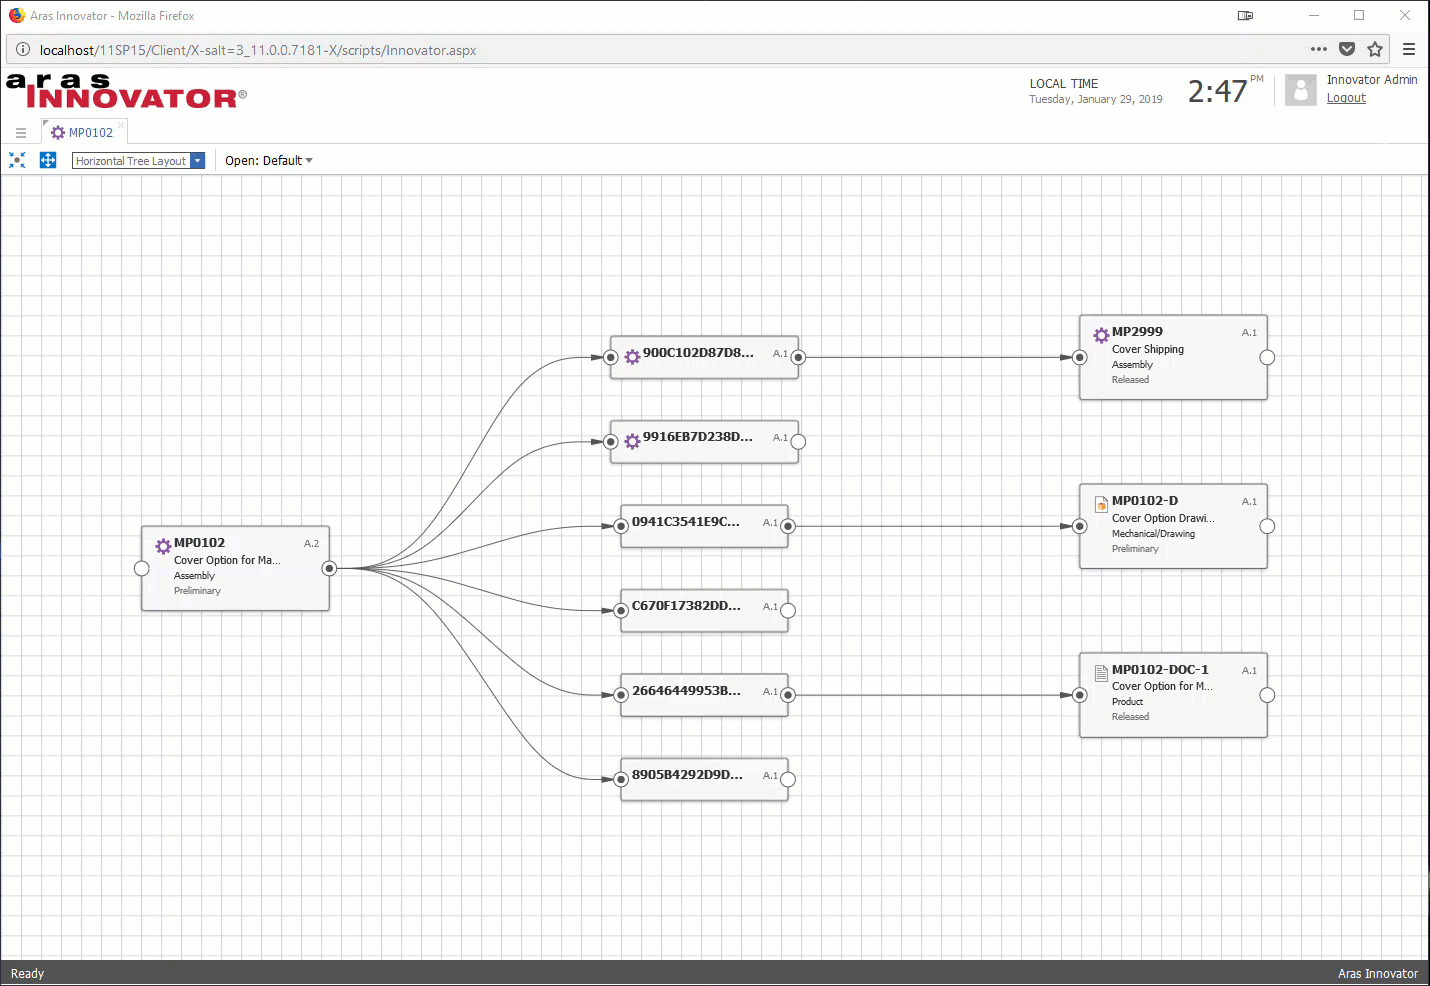
We can open an item's graph view via the Show Graph action in the main grid or the item form. By default, the root node's related items are collapsed.
Expand and Collapse
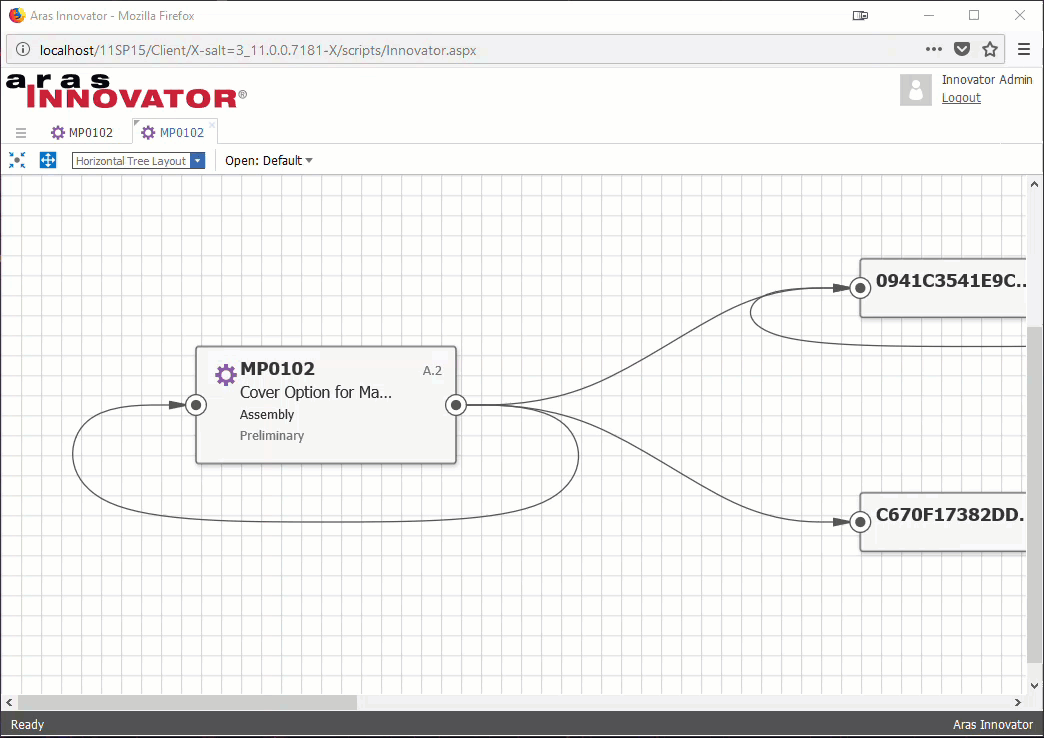
To expand or collapse an item's related data, click the round expand/collapse buttons on the edge of each item node. If a button does not appear, there are no related nodes to expand. If you want to expand or collapse all items of a certain type, right click the expand/collapse button and use the checklist to filter the relationships and item properties you want to view.
Pan and Zoom
Use the mouse wheel to zoom in and out of a graph view. To pan, press and hold the left mouse button and move the mouse. You can also use the scrollbars to pan around the graph view.
Fit & Center
Click the Fit All icon to bring all expanded content into the view. This changes the zoom level and centers the content so all nodes and connectors are visible without the need to scroll. To center the diagram on a node without changing the zoom level, right click the node and select Center in Window.
Switch Layouts
The Graph Viewer has three view layouts available that can be selected from the Layout Selector list.
- Horizontal Tree Layout: A horizontal tree is populated from left to right. This is the default layout.
- Vertical Tree Layout: A vertical tree is populated from top to bottom.
- Force Layout: The context item is displayed in the center of the graph with all connected nodes grouped around it.
Switch Graph Views
Items may have more than one Graph View available, depending on the context ItemType and the user's permissions. To switch between available Graph Views, users can select a view from the Graph View Selector list. This will open the selected view in a new tab.
Open an Item
Right-click on a node to access the context menu and then select Open Item to open the Item form in a new tab.
Open Item Graph View
Right-click on a node to access the context menu and then select Open Graph View. You can then select the Graph View you want to use to view the selected node in a new tab.
Defining Graph Views
This section outlines the two approaches to creating a Graph View in Aras Innovator - Ad Hoc and Query-based.
Ad Hoc Graph Views
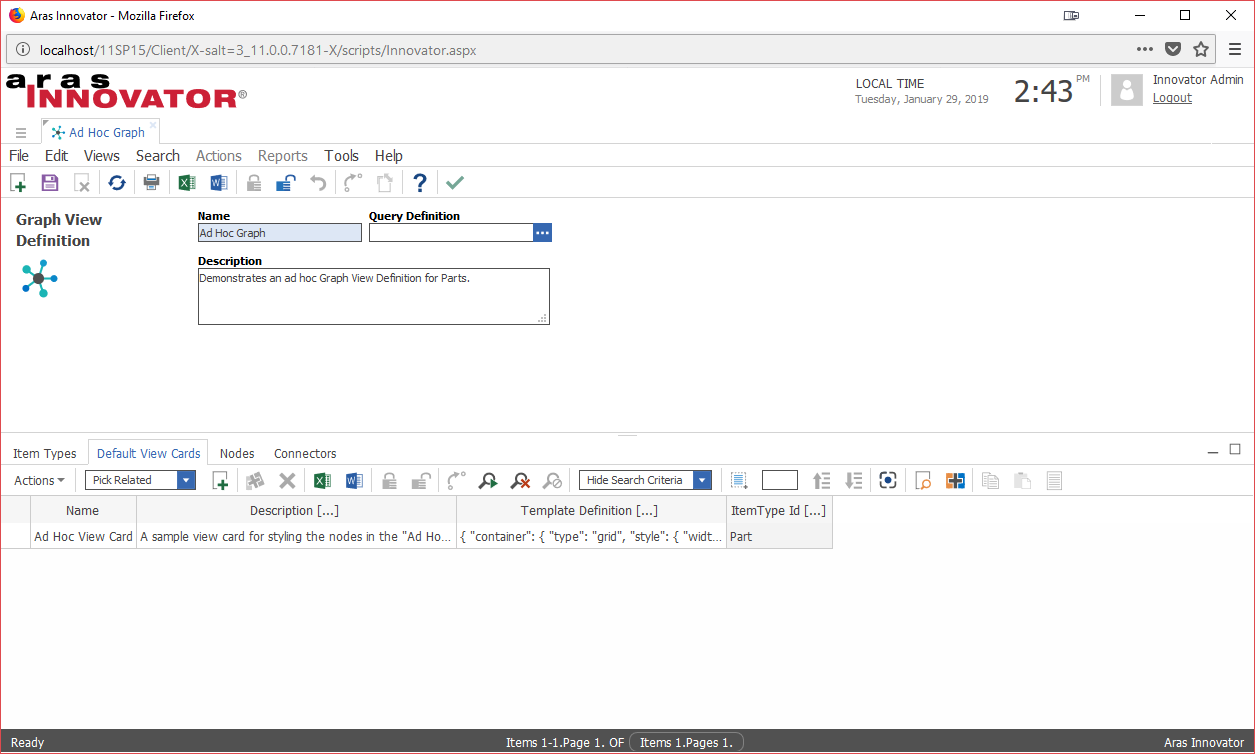
Ad Hoc Graph Views dynamically query the graph content at runtime. All of the context item's item properties and relationships are automatically included in the graph. The graph viewed in the Getting Started section above is an example of an Ad Hoc Graph View. We can also explicitly define Ad Hoc Graph Views for specific ItemTypes. This allows us to style the view without precisely defining the types of content.
Creating the Graph View
In this example we'll create a new Ad Hoc Graph View.
- Login to Aras Innovator as admin.
- In the TOC, navigate to Administration > Configuration > Graph Navigation > Graph View Definitions.
- Click the Create a New Item icon to create a new Graph View Definition item.
- Enter a name and save the Graph View Definition.
Based on this configuration, the resulting Graph View Definition will use the default style and it will be available for any ItemType with the Show Graph action.
Constraining the View to an ItemType
If we want to limit the Graph View Definition to one or more specific ItemTypes, we can use the Item Types tab. The Graph View Definition shown below has been constrained to the Part ItemType.
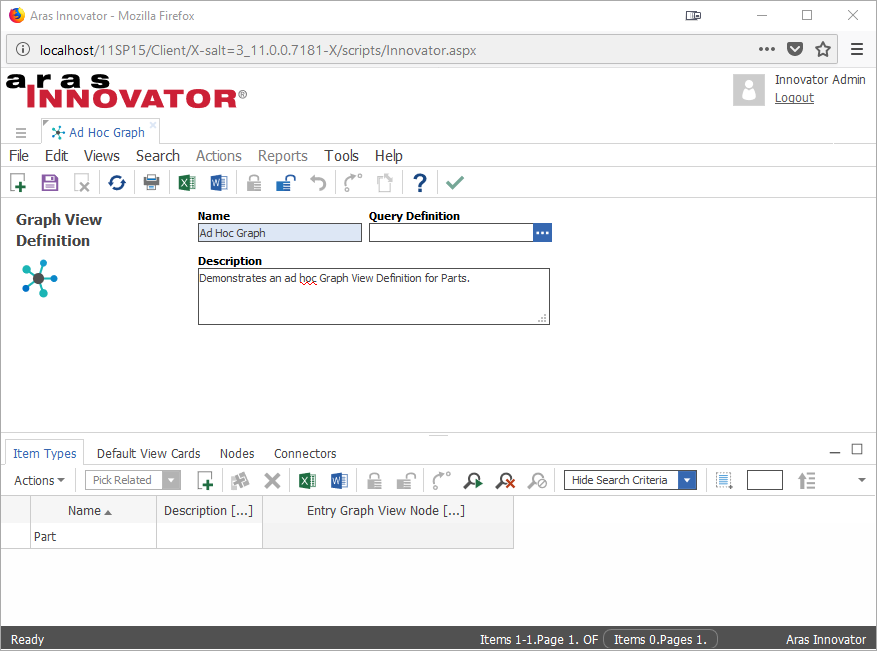
This constraint limits the root node of the graph to Part items, but it does not limit the types of items that can be reached from the root node of the graph. (See the section Query-Based Graph Views for more info.)
Setting the Default Style
In addition to the default style Aras Innovator includes for Graph Views, you can create your own custom default styles. In this example we'll use a predefined style.
1: Define a View Card
- Navigate to Administration > Configuration > Graph Navigation > View Cards in the TOC.
- Click the Create a New Item icon to create a new View Card.
- Add a name and description to the View Card.
- Paste in the Template Definition from the code snippet below. This is a JSON string that tells Innovator how to style the nodes and connectors in the graph view. We'll explore the specifics of styling graph views in a future blog post.
- Save and close the View Card.
2: Add the View Card to the Graph View Definition
- Head back to your Graph View Definition item.
- Click the Default View Cards tab.
- Click the Add New Relationship icon to pick a related View Card.
- In the search dialog, choose the View Card you just created.
- In the relationships grid, set the ItemType Id property to the ItemType you want to display using the selected View Card.
You can repeat steps 3-5 for as many View Cards and ItemTypes as you want. Any ItemTypes without an assigned Default View Card relationship will be displayed using Innovator's default style.
Once the Graph View Definition has been saved (and the gn_ShowGraphView action has been added to the specified ItemTypes), we'll be able to select our Ad Hoc Graph View from the Graph View Selector list.
Viewing the Graph
When we open the Ad Hoc Graph we'll see our custom View Card applied to the Part items.
Query-Based Graph Views
While Ad Hoc Graph Views query all relationships and property items, Query-Based Graph Views allow admins to explicitly define what data is queried by a graph. This helps filter out all but the most critical information users need to see in their graphs.
Defining the Query
In this example we'll create a new Query-Based Graph View. The process is similar to creating an Ad Hoc Graph View, but first we'll need a Query Definition. We'll use the Query Definition described in a previous Aras Labs blog post, An Introduction to Query Builder and Tree Grid View.

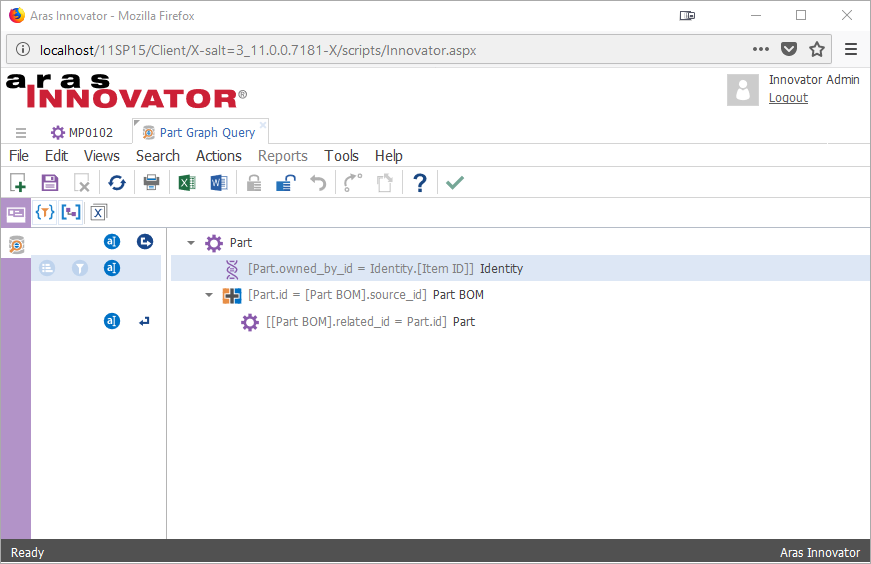
After following the section Creating Your First Query Using QB, you'll have a Query Definition that looks something like this:
Creating the Graph View
Now you're ready to start creating your Query-Based Graph View.
- Login to Aras Innovator as admin.
- In the TOC, navigate to Administration > Configuration > Graph Navigation > Graph View Definitions.
- Click the Create a New Item icon to create a new Graph View Definition item.
- Enter a name, the Query Definition you want to use, and save the Graph View Definition.
When you save the Graph View Definition, you'll see a dialog like this:
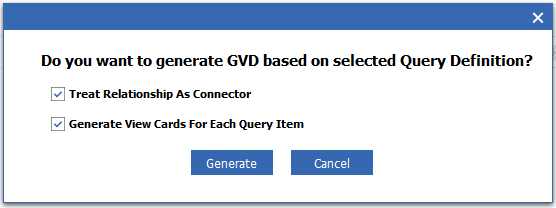
If you select the Treat Relationship As Connector option, all relationships in the Query Definition are treated as connectors. Otherwise, each relationship is drawn as a separate node and connectors will be implicit (like an Ad Hoc Graph View). We'll select this option for this example so we don't see a node/block for each Part BOM relationship.
If you select the Generate View Cards For Each Query Item option, a unique view card is generated for each Query Item and added as a GVD Default View Card. The generated view cards will have a row for each property selected for the Query Item in the Query Definition. We'll select this option so we don't have to worry about mapping the query results to an existing View Card.
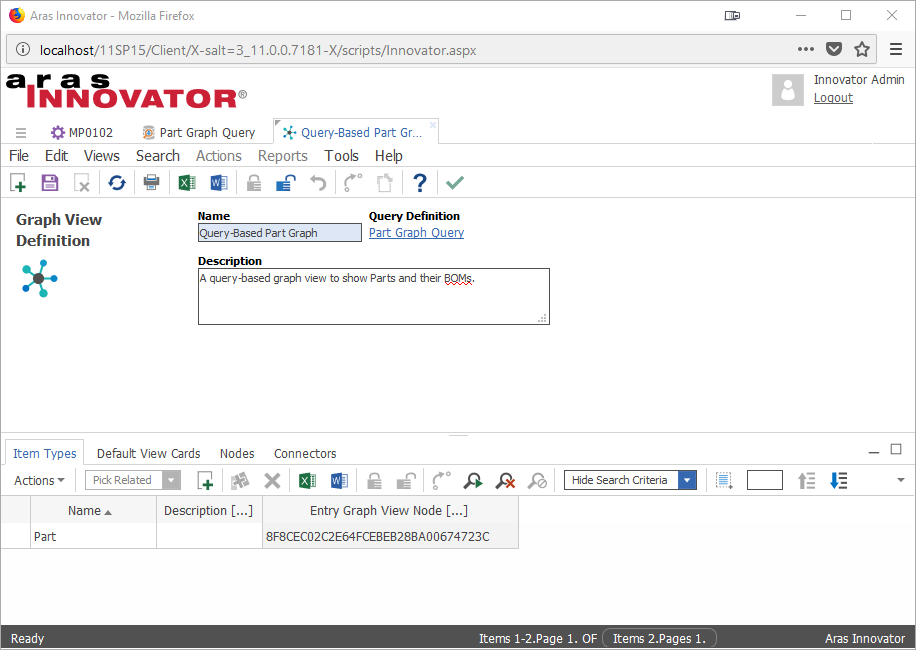
Once we select our options and click Generate, we have a Graph View Definition that looks something like this:
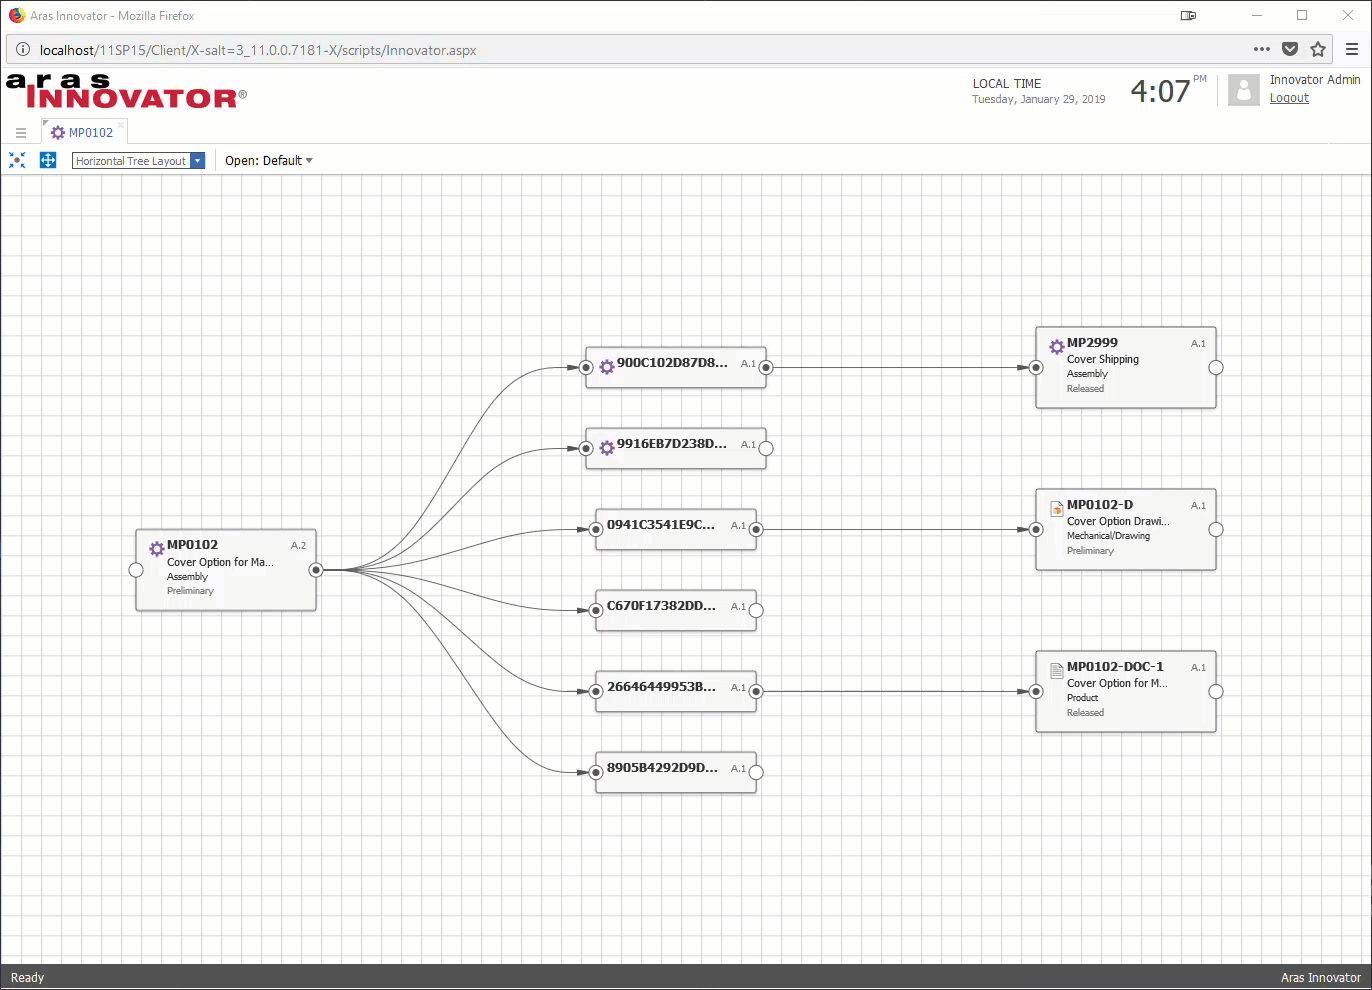
Viewing the Graph
Once the Graph View Definition is saved, we can select it from the Graph View Selector just like we did with the Ad Hoc Graph View.
Well that wraps up this introduction to Graph Navigation in Aras Innovator! We have another blog post coming soon with more information on Graph Navigation, like customizing node content, styling views, and opening a specific Graph View directly from an item.
Looking for More Aras Inspiration?
Subscribe to our blog and follow @ArasLabs on Twitter for more helpful content! You can also find our latest open-source projects and sample code on the Aras Labs GitHub page.