


With the release of Aras Innovator® 28, we’re delivering a new Platform Component, Reporting. Reporting allows for an increase in collaboration and traceability throughout the platform. This tool allows you to easily share detail-oriented views, which can quickly provide people with the data they need. This blog will review the basic structure of the new reports, and how to configure a basic report in your Aras Innovator instance.
Overview
The new reporting application can be found directly in the My Innovator portion of the Table of Contents. Here, you can see any reports that are available to you through the Aras Innovator permission model. Reports function as they always have. They query live data and show tables. Here’s an example of a simple report that shows all ECOs in the system with very few filters.
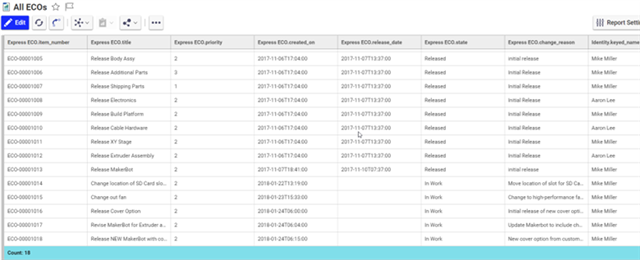
While it may look like a standard search grid, the bottom row shows the most basic function, aggregation. We can apply all sorts of filters and aggregations to our reports to better understand the data being collected. In the top right, we can see a button called Report Settings. This button shows the form of the Report item and the relationships that can be modified to further customize your report.
Creating a new Report
Let’s quickly walk through the steps of creating a new report from scratch. Reports can be created just like any other ItemType. Go to the TOC, find reporting under My Innovator, and create a new Item. Here we can add a name and, more importantly, set the context of our Report. The Context relates directly to a Query Definition.
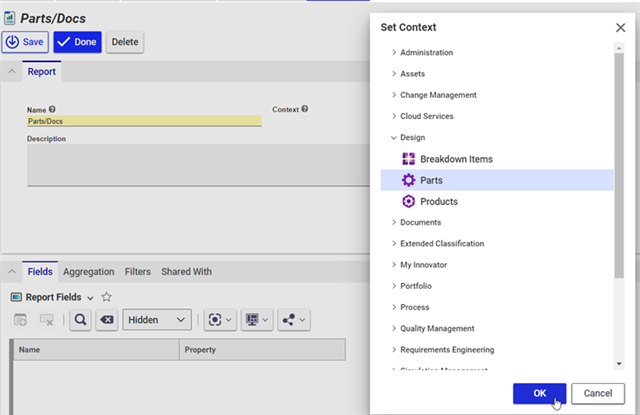
 The Set Context dialog allows you to pick from any ItemType in the TOC, however if there are no Query Definitions which use the selected ItemType as their starting point, you’ll receive an error. I’ve selected Part, as I know there are Query Definitions related to parts that come out of the box.
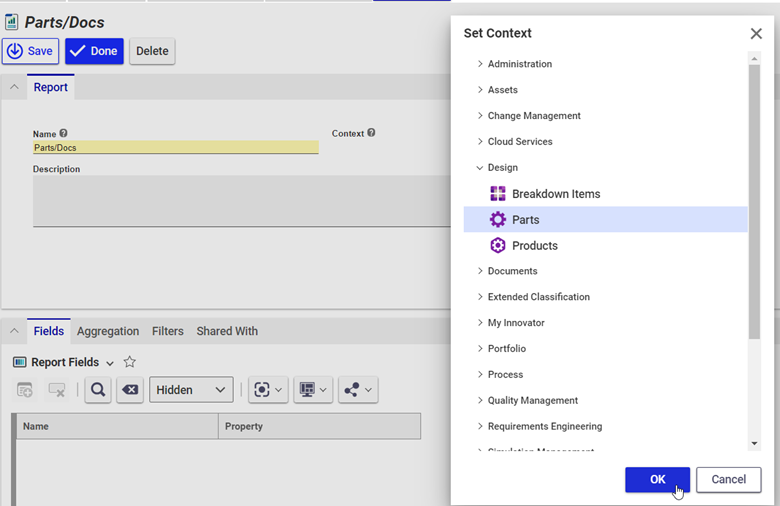
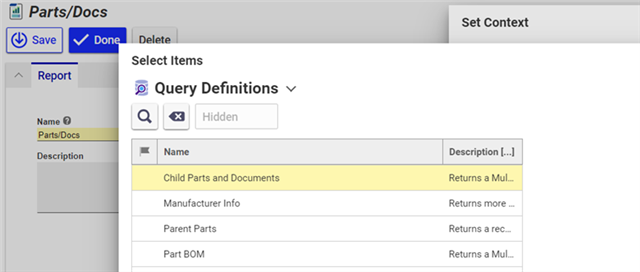
I’m going to choose the Child Parts and Documents Query Definition, as that will show that a Report can contain multiple different ItemTypes within the same view. Once you’ve selected your context, press save, and the Report will do the rest! Looking at our relationships, we now have properties automatically pulled from our Query Definition, and we can customize further with aggregations and filters.
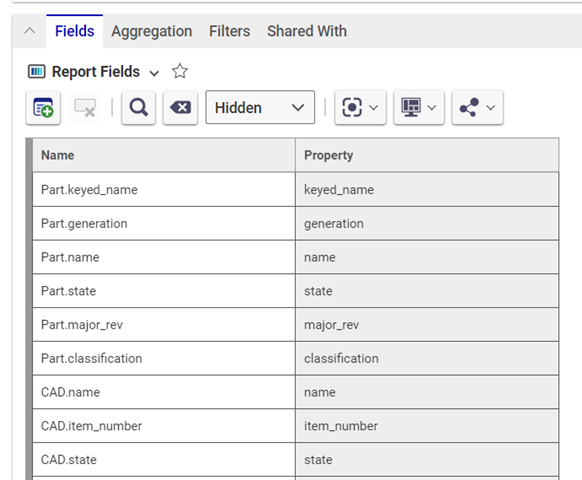
As you can see, the fields are automatically generated. The tabs to the right allow you to set aggregations, filters, and share your report with different users.
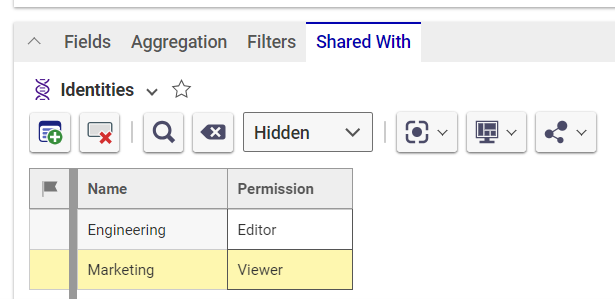
It’s important to note that the Shared With relationship not only allows you to share your reports with individuals, but also with entire groups. For this example, I’ve shared my report with the Engineering and Marketing groups. It’s important to note that you can also set permissions based on identity as well. This allows us to share these views with larger groups, and not have to worry about unexpected changes.
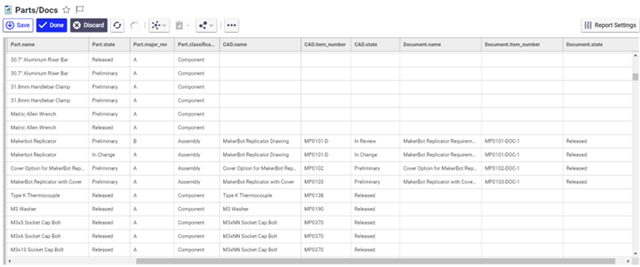
Now that our Report is ready, if we press the Preview button in the top right, we’ll be able to see our report in its entirety. It should look like the screenshot below. Note that we’re pulling information from three different ItemTypes through this one report, using the power of Query Definition.
 Conclusion
The new Reporting will allow you to quickly and easily create these robust views. If you’d like to know more about Query Definitions and how they can be used to bolster Reports, please take a look at some of our older Labs blog posts. We go over how to create and customize Query Definitions in great detail. Let us know how you’re using reporting or if you have any questions in the comments below.