Graphs have been eating the world for the last few year. Every time you start a PLM implementation you will draw a datamodel with nodes (itemtypes) and edges (relationships). A few years ago I made a project to draw the datamodel graph. I was sharing the script but I'm not sure I actually explained how I did it. So here is a quick tutorial on how to quickly add a graph visualisation to Aras.
The graph library: Cytoscape
You could use other graph libraries, it's just that I've been used to play with cytoscape. The webpage has a lot of sample and if you follow this project you will see that it is well maintained and active.

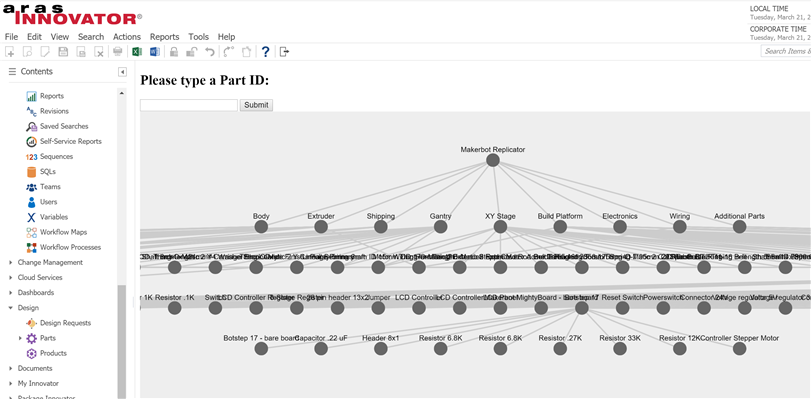
In this tutorial I want to get something pretty similar to the following picture where at the top I would have the selected part and then I would show the whole BOM underneath it.

It is all developped client side (javascript) and the typical data you send to the graph library to add nodes and edges is the following:
var eles = cy.add([
  { group: "nodes", data: { id: "n0" }, position: { x: 100, y: 100 } },
  { group: "nodes", data: { id: "n1" }, position: { x: 200, y: 200 } },
  { group: "edges", data: { id: "e0", source: "n0", target: "n1" } }
]);
We won't really care about the positionning as we will use a layout to let it draw by itself.
Creating a TOC entry just accessing the graph page
The graph could potentially be started from a context menu but for this tutorial I'll use a TOC entry.
- Create a new Itemtype

- Add a Toc Access and a Toc View targetting the script file that we will add to our filesystem (here in innovator/client/scripts/custom/graph/index.html)

Developping the script
my typical Hello-world script
I usually start with the following script. I just added a reference cytoscape.
<!DOCTYPE html>
<head> <style> body { width: 100%; height: 100%; } </style> </head>
<body> <h1>Hello World</h1> </body>
<script src="cytoscape.min.js"></script>
<script> $(document).ready(function () { console.log("ready"); }); </script>
</html> Cytoscape is mandatory here because it's the graph library.
Querying the BOM
As you are in the Aras Innovator interface you benefit from the Aras general context. You can then retrieve the Innovator class by typing the following:
var inn = top.aras.newIOMInnovator();
and create an item query :
var myPart = top.aras.newIOMItem('Part', 'get');
Let's create a function which takes a part ID as a parameter. The target is to produce an AML query equivalent to this:
<Item type="Part" select="item_number" action="GetItemRepeatConfig" id="{your part ID}">
  <Relationships>
    <Item type="Part BOM" select="related_id,quantity" repeatProp='related_id' repeatTimes='10'/>
  </Relationships>
</Item>
The resulting function is the following :
    function getBOM(partId) {
        // query the starting Part
        var myPart = top.aras.newIOMItem('Part', 'GetItemRepeatConfig');
        myPart.setAttribute("select", "item_number,name");
        myPart.setID(partId);
// add the repeated relationship var myRel = top.aras.newIOMItem('Part BOM', 'get'); myRel.setAttribute("select", "related_id,quantity"); myRel.setAttribute("repeatProp", "related_id"); myRel.setAttribute("repeatTimes", "10");
myPart.addRelationship(myRel);
// apply the query var result = myPart.apply(); return result; }
Updating the interface
Now that we know we can get the data, we will provide the interface for the user to type a part Id and a place to show the graph.
Here is the new body Tag :
<body>
   <h2>Please type a Part ID:</h2>
   <input id="partid" type="text">
   <button onclick="createGraph()">Submit</button>
   <div id="graph"></div>
</body>
and we add some CSS
 #graph {
   width: 100%;
   height: 500px;
   background-color: #EEE;
 }
You should get this :

Parsing the BOM to create nodes and edges
The result of the query is a nested XML containing the Parts and the Part BOMs. But we can use the power of xpath to select only the nodes or only the edges.
function BOMtoGraph(BOM){
// parse Parts as nodes var graphData = []; var nodeElts = BOM.getItemsByXPath("//Item[@type='Part']");
for(var i=0; i<nodeElts.getItemCount();i++){ var nodeElt = nodeElts.getItemByIndex(i); var node = { group: "nodes", data: { id: nodeElt.getID() } } graphData.push(node); }
// parse Part BOM as edges var edges = []; var edgeElts = BOM.getItemsByXPath("//Item[@type='Part BOM']");
for(var i=0; i<edgeElts.getItemCount();i++){ var edgeElt = edgeElts.getItemByIndex(i); var edge = { group: "edges", data: { id: nodeElt.getID(), source: nodeElt.getProperty("source_id"), target: nodeElt.getProperty("related_id") } } graphData.push(edge); } return graphData; }
Loading the graph
Now we just have to read the cytoscape documentation again and initialize the graph with the data we created.
function displayGraph(DomIdSelector, graphData, rootId) {
var cy = cytoscape({ container: document.getElementById(DomIdSelector), elements: graphData, style: [ // the stylesheet for the graph { selector: 'node', style: { 'background-color': '#666', 'label': 'data(name)' } }, { selector: 'edge', style: { 'width': 3, 'line-color': '#ccc', 'target-arrow-color': '#ccc', 'target-arrow-shape': 'triangle' } } ], layout: { name: 'breadthfirst', directed: true, padding: 0.1, spacingFactor:0.4 } }); }
Assembling Everything
Now you just need to finalize by calling the various created functions on the submit button click
    function createGraph() {
        var partId = document.getElementById("partid").value;
        var BOMcontent = getBOM(partId);
        var graphData = BOMtoGraph(BOMcontent);
        displayGraph("graph", graphData, partId);
    }
And here is the result !

Enhancements
A few potential enhancements:
- The graph layout can be highly enhanced. I'll try to provide a version using cola which allows to dynamically place the elements.
- Showing the partBOM elements as nodes to show potential items like Part Instances that are attached to the Part BOM.
- Add click and double click events on nodes and links to show information and potentially open Aras objects.
Here is the complete Gist ! Have fun drawing graphs with Aras data !