


"Customize don't compromise" is one of our mottoes at Aras. We want our partners and customers to feel and understand that our solution is right for adapting a model to the customer's needs. We don't avoid standards. We try to implement as many business standards as we can, but PLM projects need customizing 100% of the time. I haven't seen a PLM project without customization.
Once you realize you will need customization/configuration, you need to look at two aspects:
- The ease of customization
- The ease of control of these customizations
Today I want to a share a script that I wrote recently after being asked by a few customers to export the data model of an Aras Innovator instance because it would help them understanding and being in control of their customized instance.
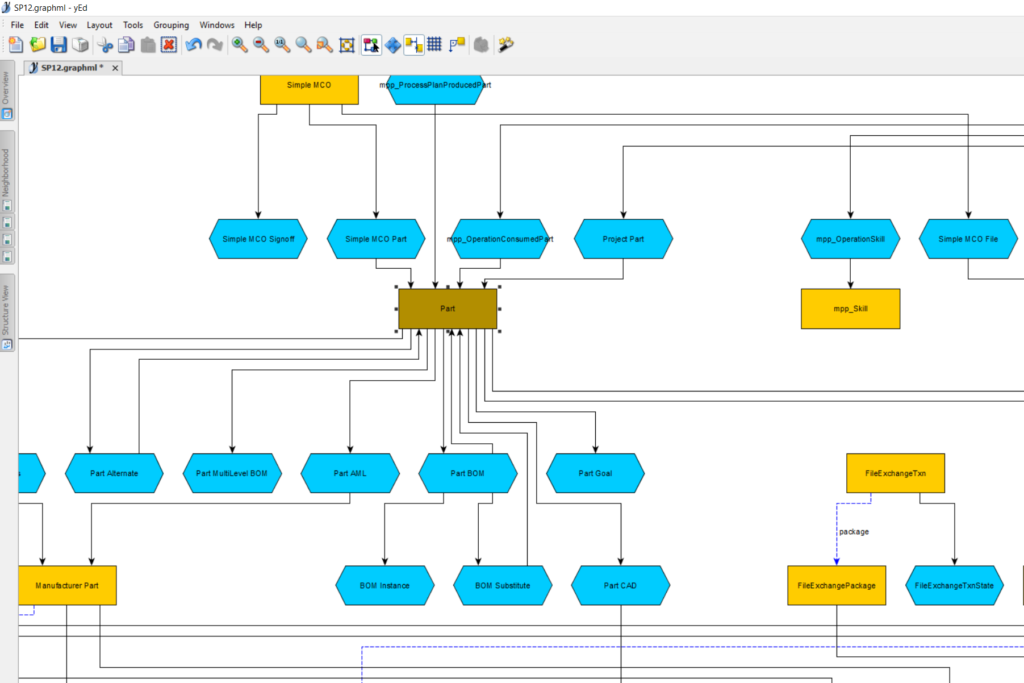
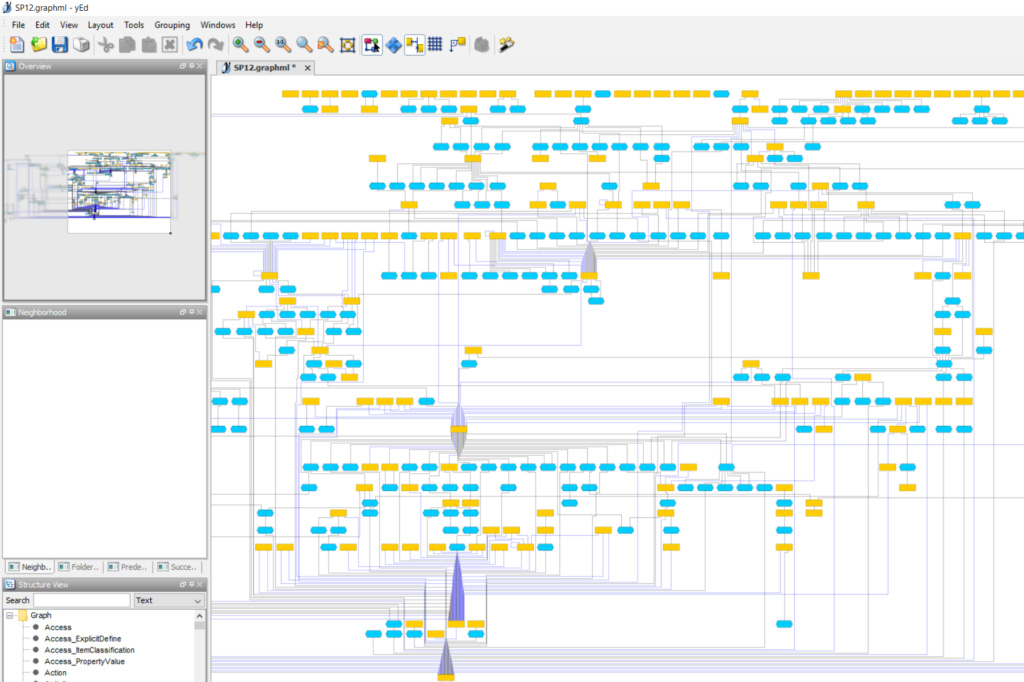
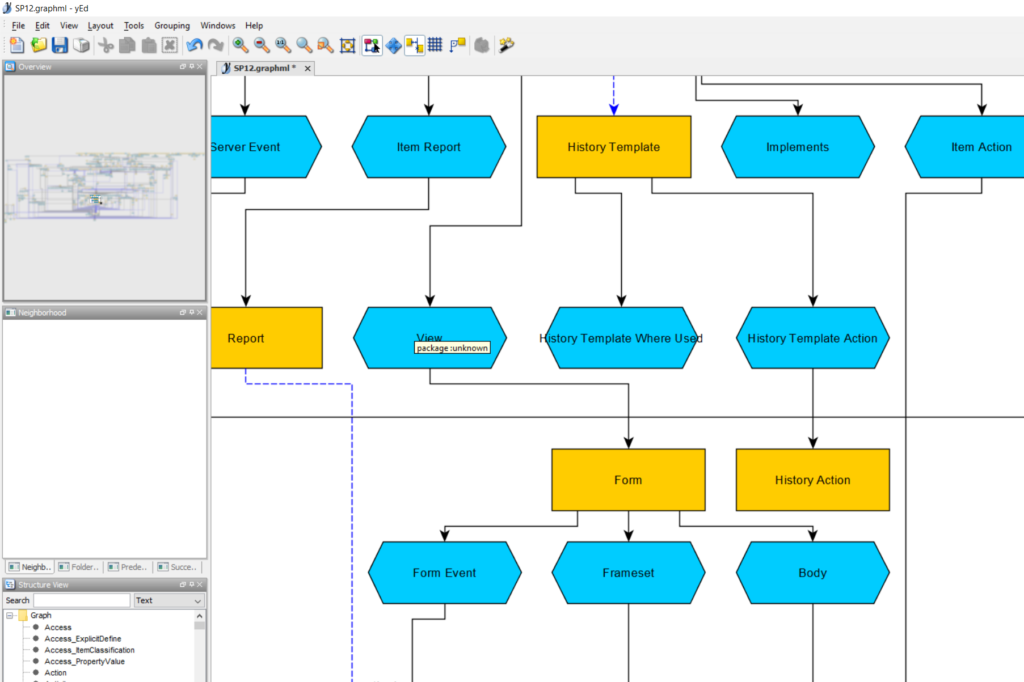
This script basically queries Aras Innovator using our API (IOM.dll) and looks for ItemTypes, RelationshipTypes, and item properties (I haven't handled the PolyItems yet). It converts the result of these queries into GraphML format. This allows software like yEd to layout a human-readable data model diagram, helping you understand the Aras instance being implemented.
Check out a few screenshots of the results:
Here is the vb.net script:

LOOKING FOR MORE ARAS INSPIRATION?
Subscribe to our blog and follow @ArasLabs on Twitter for more helpful content! You can also find our latest open-source projects and sample code on the Aras Labs GitHub page.
And don’t forget to register for ACE 2018! Join the Aras Labs team and the Aras community in Indianapolis for three days of learning, networking, and collaboration.